Supertrend Indicator: Spot Trends Like a Pro
The Supertrend Indicator is a popular technical tool used to identify market trend direction and potential entry and exit points. It works best in trending markets and is widely used by Indian stock and index traders. It’s essentially a "traffic light" for traders, providing clear visual signals directly on a price chart.
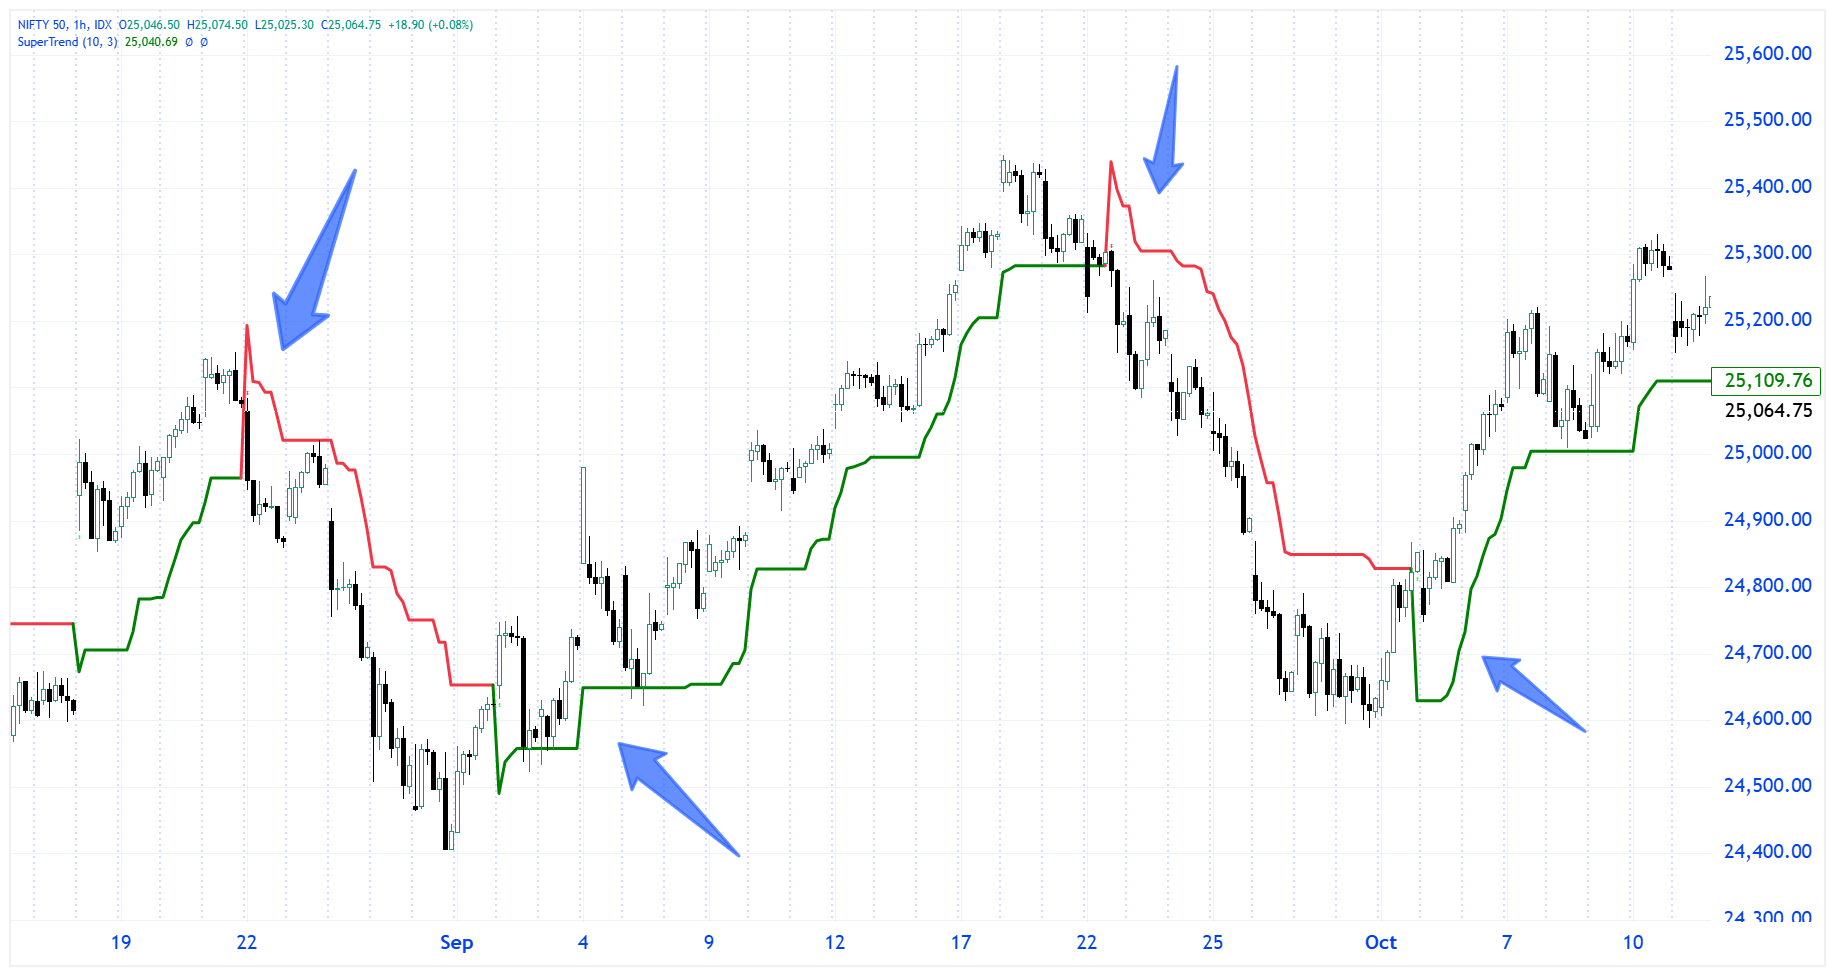
How it Works: Supertrend is based on ATR (Average True Range), which measures market volatility. It plots a single line on the price chart that changes color based on the trend.
Green line below price ? Uptrend
Red line above price ? Downtrend
Reading the Signals:
Green Line Below Price: Indicates an uptrend (bullish/buy signal).
Red Line Above Price: Indicates a downtrend (bearish/sell signal).
The Supertrend line itself acts as a trailing stop-loss
Key Settings:
Common settings: ATR Period 10, Multiplier 3
Lower multiplier = more signals (but more noise)
Higher multiplier = fewer signals (more reliable)
Best Use:
Works well in trending markets
Very effective on Index, Stocks, and Futures
Combine with support-resistance or volume for better accuracy
Limitations:
Gives false signals in sideways markets
Should not be used alone for high-risk trades
Final Thought:
Supertrend is simple, visual, and powerful for trend following. Use it with discipline, proper risk management, and confirmation from other tools for consistent results.